Governance Registry
Role
Product designer and builder: workflow, information design and front-end
Stakeholders
AI governance leads, risk reviewers, the investment committee and business teams
Tools
Figma, Next.js, React, Tailwind CSS, Recharts, GSAP & Claude Code
Timeline
10 weeks · Jul – Sep 2026

Idea-to-decision time fell from 34 to 21 days, intake completion rose 2.4×, and committee prep dropped from a day to an hour.
Before an AI use case goes live at a large company, someone has to qualify it, assess its risk, cost it, approve it, build it and monitor it. That record usually sits in spreadsheets and email. Governance Registry keeps it in one place: **twelve stages in four phases, with a review gate between phases.** It has three modes: **Registry** for your own work, **Map** for where every use case stands, and **Reporting** for the committee.
Problem
Intake forms are filled in badly, so the first review is spent working out what the idea is.
Solution
- — Intake is a chat that fills in the record as you describe the idea
- — The assistant only asks for what the stage still needs
Problem
With twelve stages and four gates, nobody can tell where a use case is or who it’s waiting on.
Solution
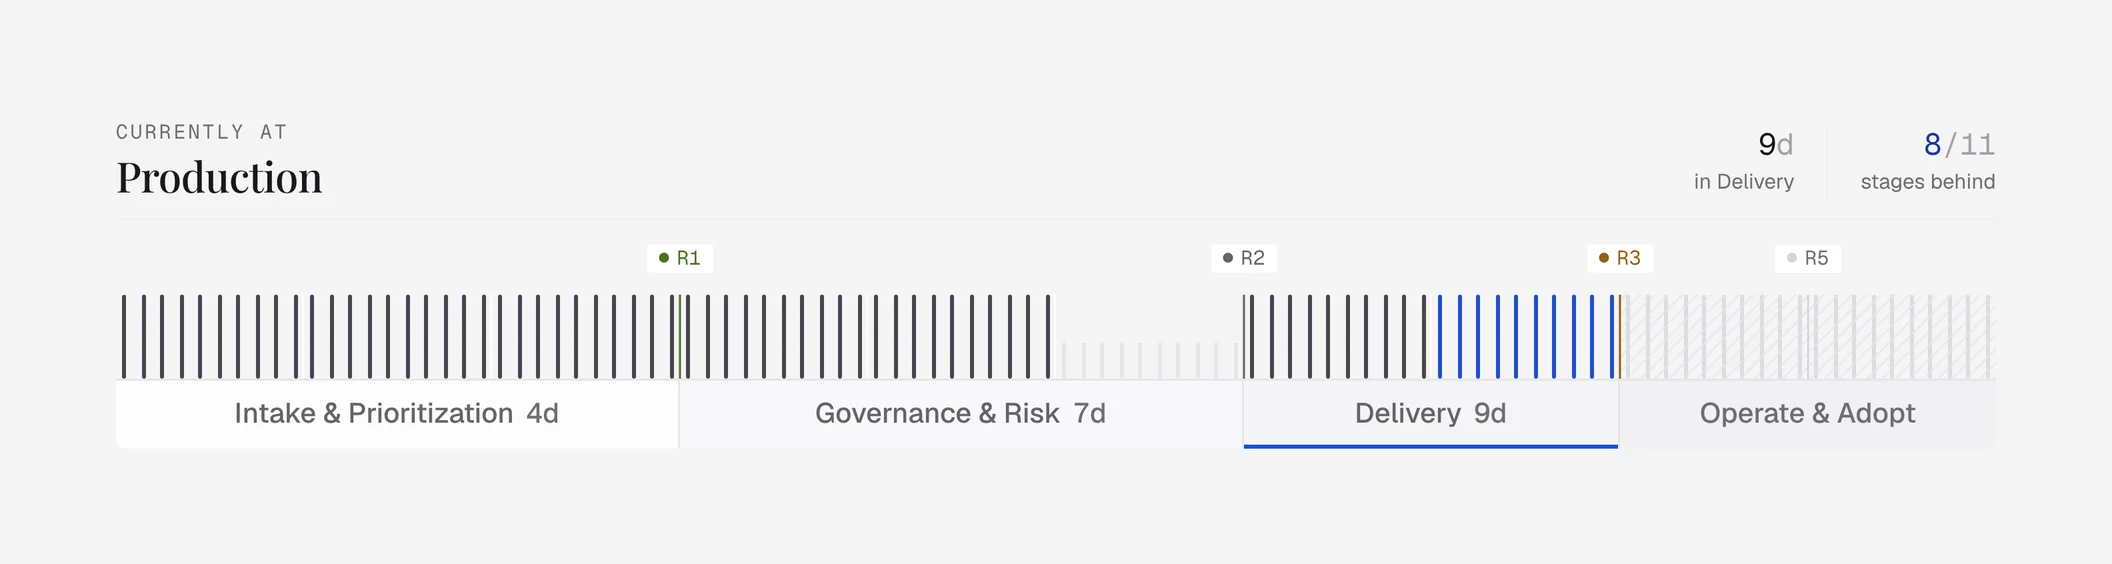
- — Each record shows its progress through phases and gates, with time spent in each
- — Each card shows the one action that’s yours
Problem
The committee was given a 22-chart dashboard and read none of it.
Solution
- — Cut to ten blocks
- — A short written summary of the quarter, with two next steps
Large companies now have dozens of teams that want to use AI: a summariser for medical writers, a reply drafter for support, a classifier for invoices. Each idea is a use case, and before one goes live someone has to check what could go wrong, approve the money, and record who keeps watch over it.
Where this was built, that trail lived in a spreadsheet, email threads and a slide deck rebuilt every quarter. Nobody could say how many use cases there were, where each one was stuck, or who it was waiting on.
How a use case moves: four phases, with a decision gate after each
Phase 1
Intake
Someone describes an idea. It’s checked, scored and prioritised.
Gate R1 · ScreeningPhase 2
Governance & risk
The risks are assessed, the business case is costed, and an investment committee says go or no-go.
Gate R2 · InvestmentPhase 3
Delivery
It’s planned, built and reviewed before it goes live.
Gate R3 · Build reviewPhase 4
Operate & adopt
It’s monitored against its targets and rolled out to more teams.
Gate R5 · Post-launch reviewWhy now: regulators expect the paper trail
Jan 2023
NIST AI RMF 1.0
A voluntary framework for mapping and managing AI risk.
Dec 2023
ISO/IEC 42001
The first management-system standard for AI.
Aug 2024
EU AI Act in force
Obligations scale with a system’s risk tier.
Feb 2025
Prohibitions apply
Plus AI literacy duties for staff using AI.
Aug 2025
GPAI obligations
Rules for general-purpose models apply.
Aug 2026
High-risk obligations
Risk management, oversight and records for high-risk systems.
Constraints
- — The lifecycle came from the company’s existing governance process. The job was to make it easier to follow, not to change it
- — Five different roles touch every use case, and each needs a different first screen
- — A prototype: no backend, and the AI is simulated, so every state had to be designed by hand
Raises ideas
Business teams
Know the problem, not the process. Need to describe an idea and see where it is, without learning the process first.
Moves records
Stage owners
Risk, legal, data and delivery leads. Need to see what is waiting on them and record a decision with its evidence.
Decides
The committee
Approves investment at the GTAC gate. Needs to see how the portfolio is doing and what is stuck, without a slide deck.
Owns
Governance lead
Accountable for the register as a whole. Needs every record’s risk tier and oversight, on demand.
Today the register is a spreadsheet, approvals happen in email, and the committee works from slide decks. The AI governance platforms on the market are built for risk teams, so the people proposing ideas never use them.
Policy tools know the rules. Delivery tools know the work. Neither covers both.
- Governance Registry
- 01AI governance platformsmodel risk, compliance
- 02GRC suitesrisk registers
- 03SharePointevidence, policies
- 04Email & decksapprovals, packs
- 05Spreadsheetsthe de facto register
- 06ServiceNowrequest & change
- 07Jiradelivery tickets
- 08MLOps toolsmodel lifecycle
Describing the idea is the intake
A conversation fills in the form. Nobody starts with forty fields.
One action, and it’s yours
A card shows the one thing waiting on you. Everything else is a click away.
Colour means something
One blue and three status colours. Everything else is grey.
Cut what nobody reads
If an accurate chart doesn’t lead to a decision, it goes.
A full-screen chat instead of a form. Describe the problem in your own words; the assistant asks follow-up questions and fills in the record alongside.
A board of use cases where each card shows only the action that’s yours. Open one to see where it is in the lifecycle, which gates it has passed and what comes next.
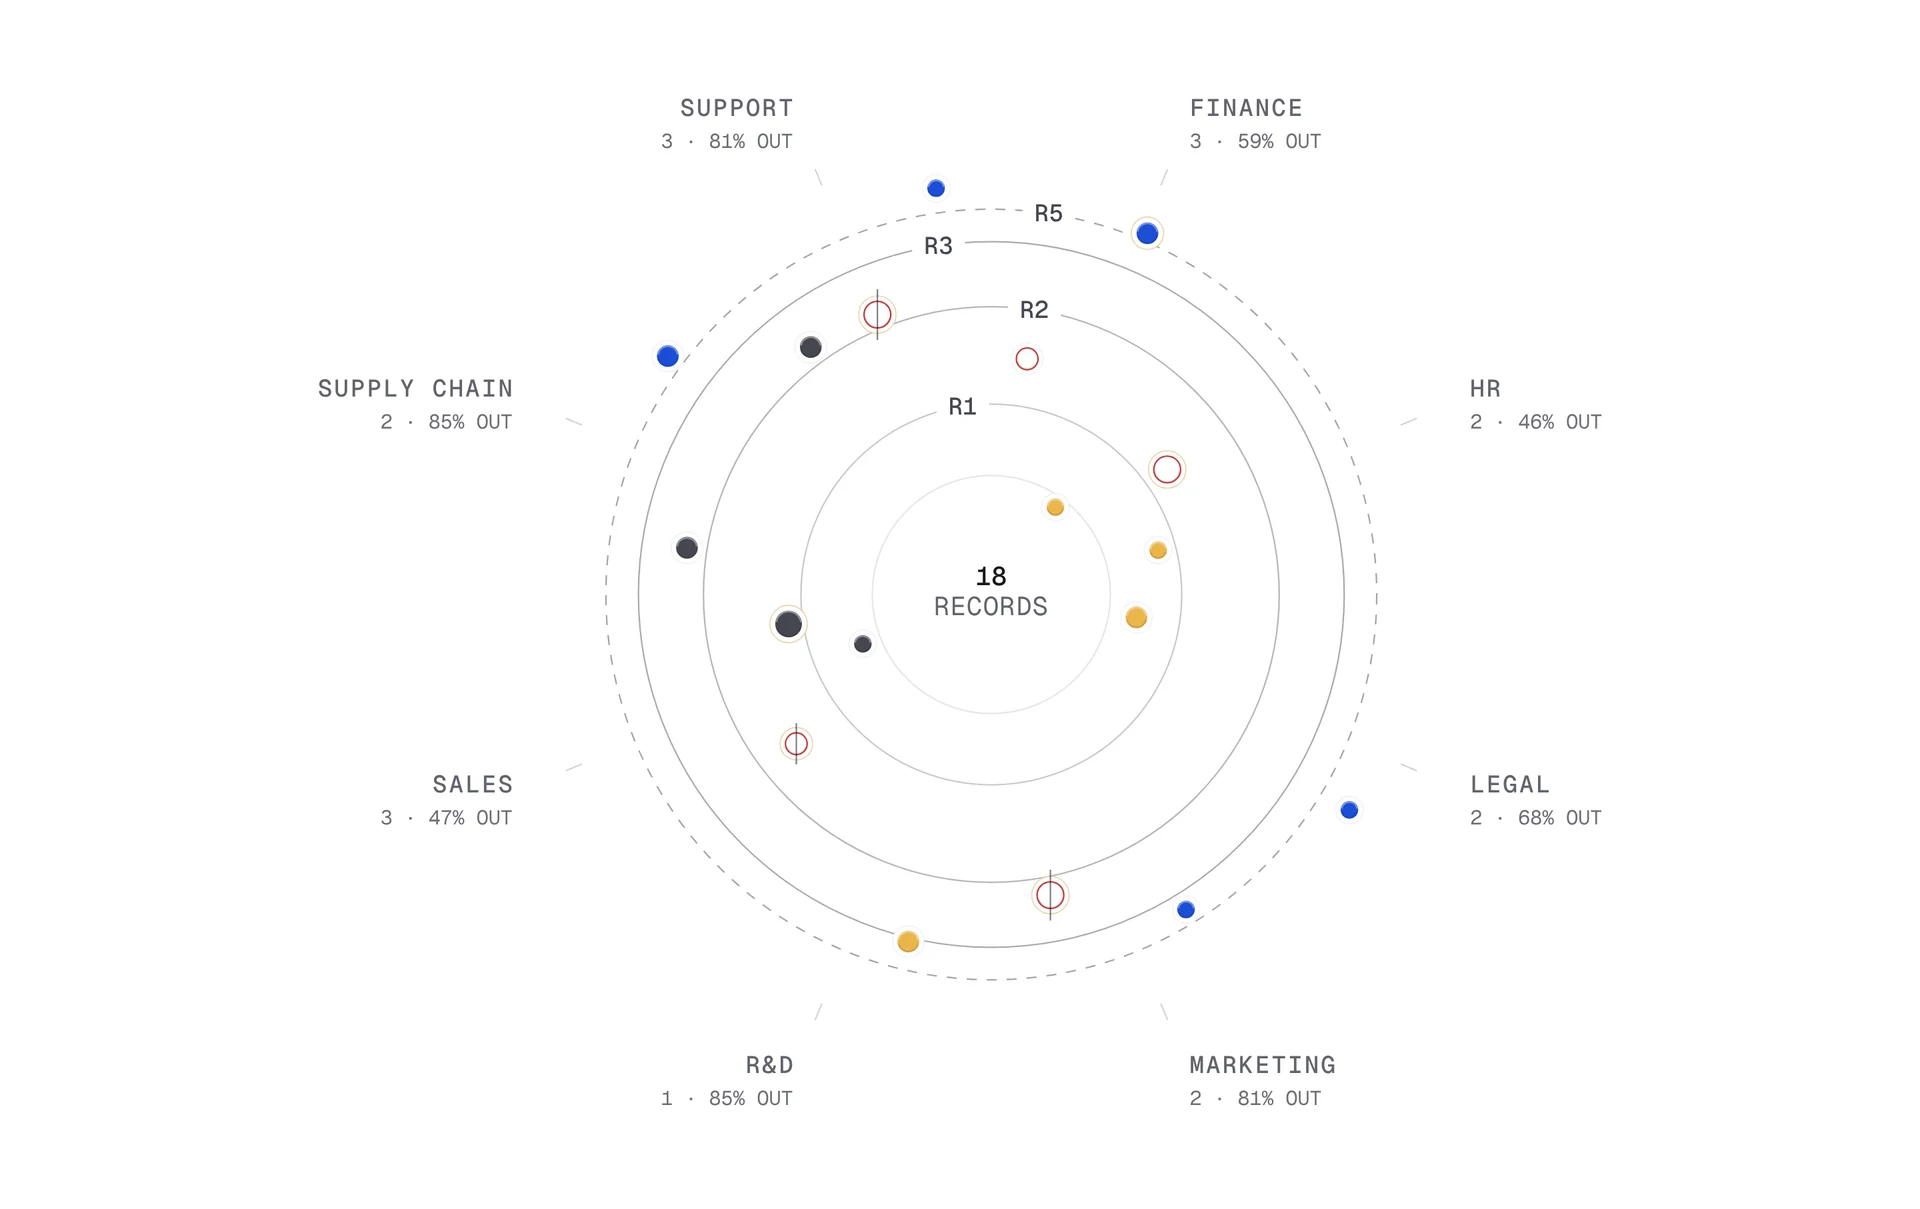
Every use case on one circular chart. The angle is the business function and the distance from the centre is how far through the lifecycle it is. Dot size shows risk; a red ring means it has less oversight than its risk requires.
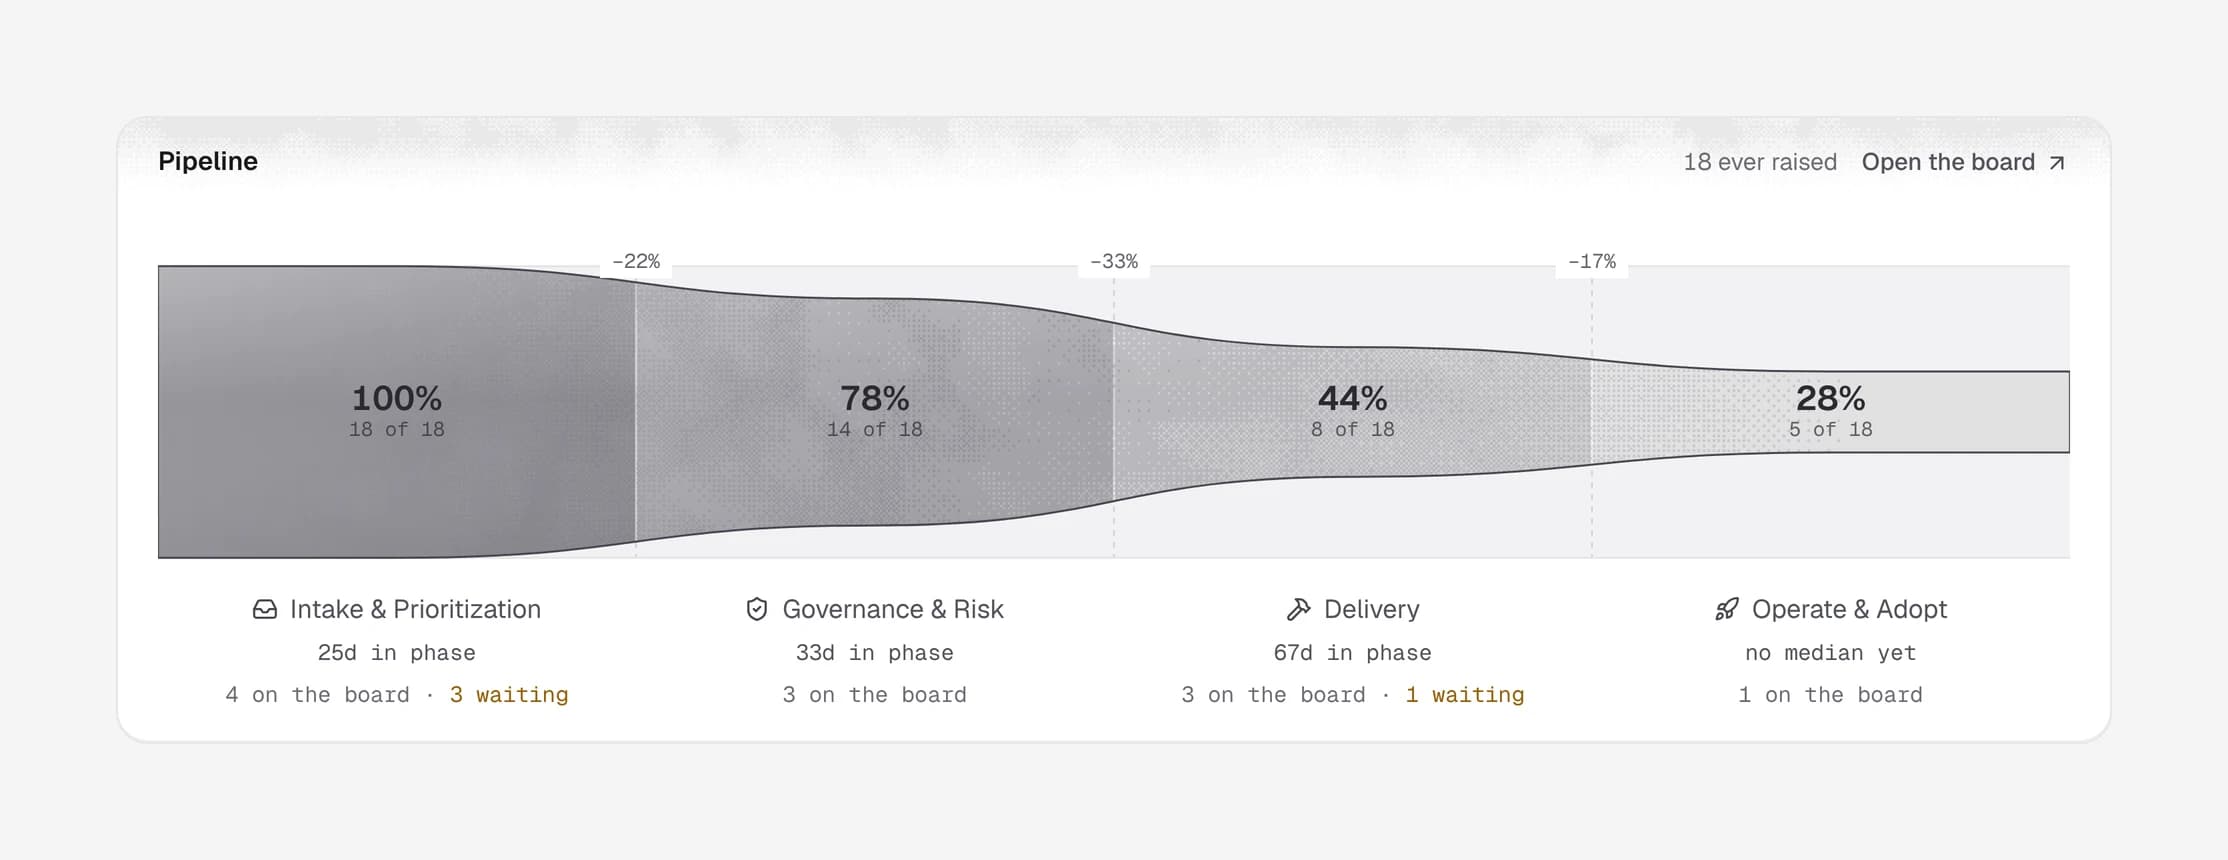
The committee’s view, in three tabs: Overview, Pipeline and Value. It went from 22 charts to ten, and the figure the committee actually used now comes first.
SVG → canvas
The map started as about 1,100 SVG elements and stuttered on every zoom. Redrawn on a canvas, the slowest frame went from 73ms to 15ms, and dropped frames from 46 to none.
Three lenses → one marker
Governance, Risk and Value views each recoloured the same dots. One marker now shows state, risk, oversight, obligations and whether it’s agentic, each in a different way.
22 charts → 10
Reporting had five tabs. Two tabs and a health score nobody could act on were removed.
Pre-filled → empty
Untouched toggles showed their first option, so blank stages looked answered. Empty fields now start empty.
Moderated sessions with 9 participants: four requesters, three stage owners and two committee members, all on the same sample registry. Tasks: propose a new idea, clear what’s waiting on you, and brief the committee on the quarter.
What we learned
- — Requesters finished intake in a median 6 minutes by chat, against 22 on the old form.
- — 8 of 9 found a stuck use case on the map in under 30 seconds.
- — Committee members prepared from the quarterly summary and its two next steps alone, so that summary now opens Reporting.
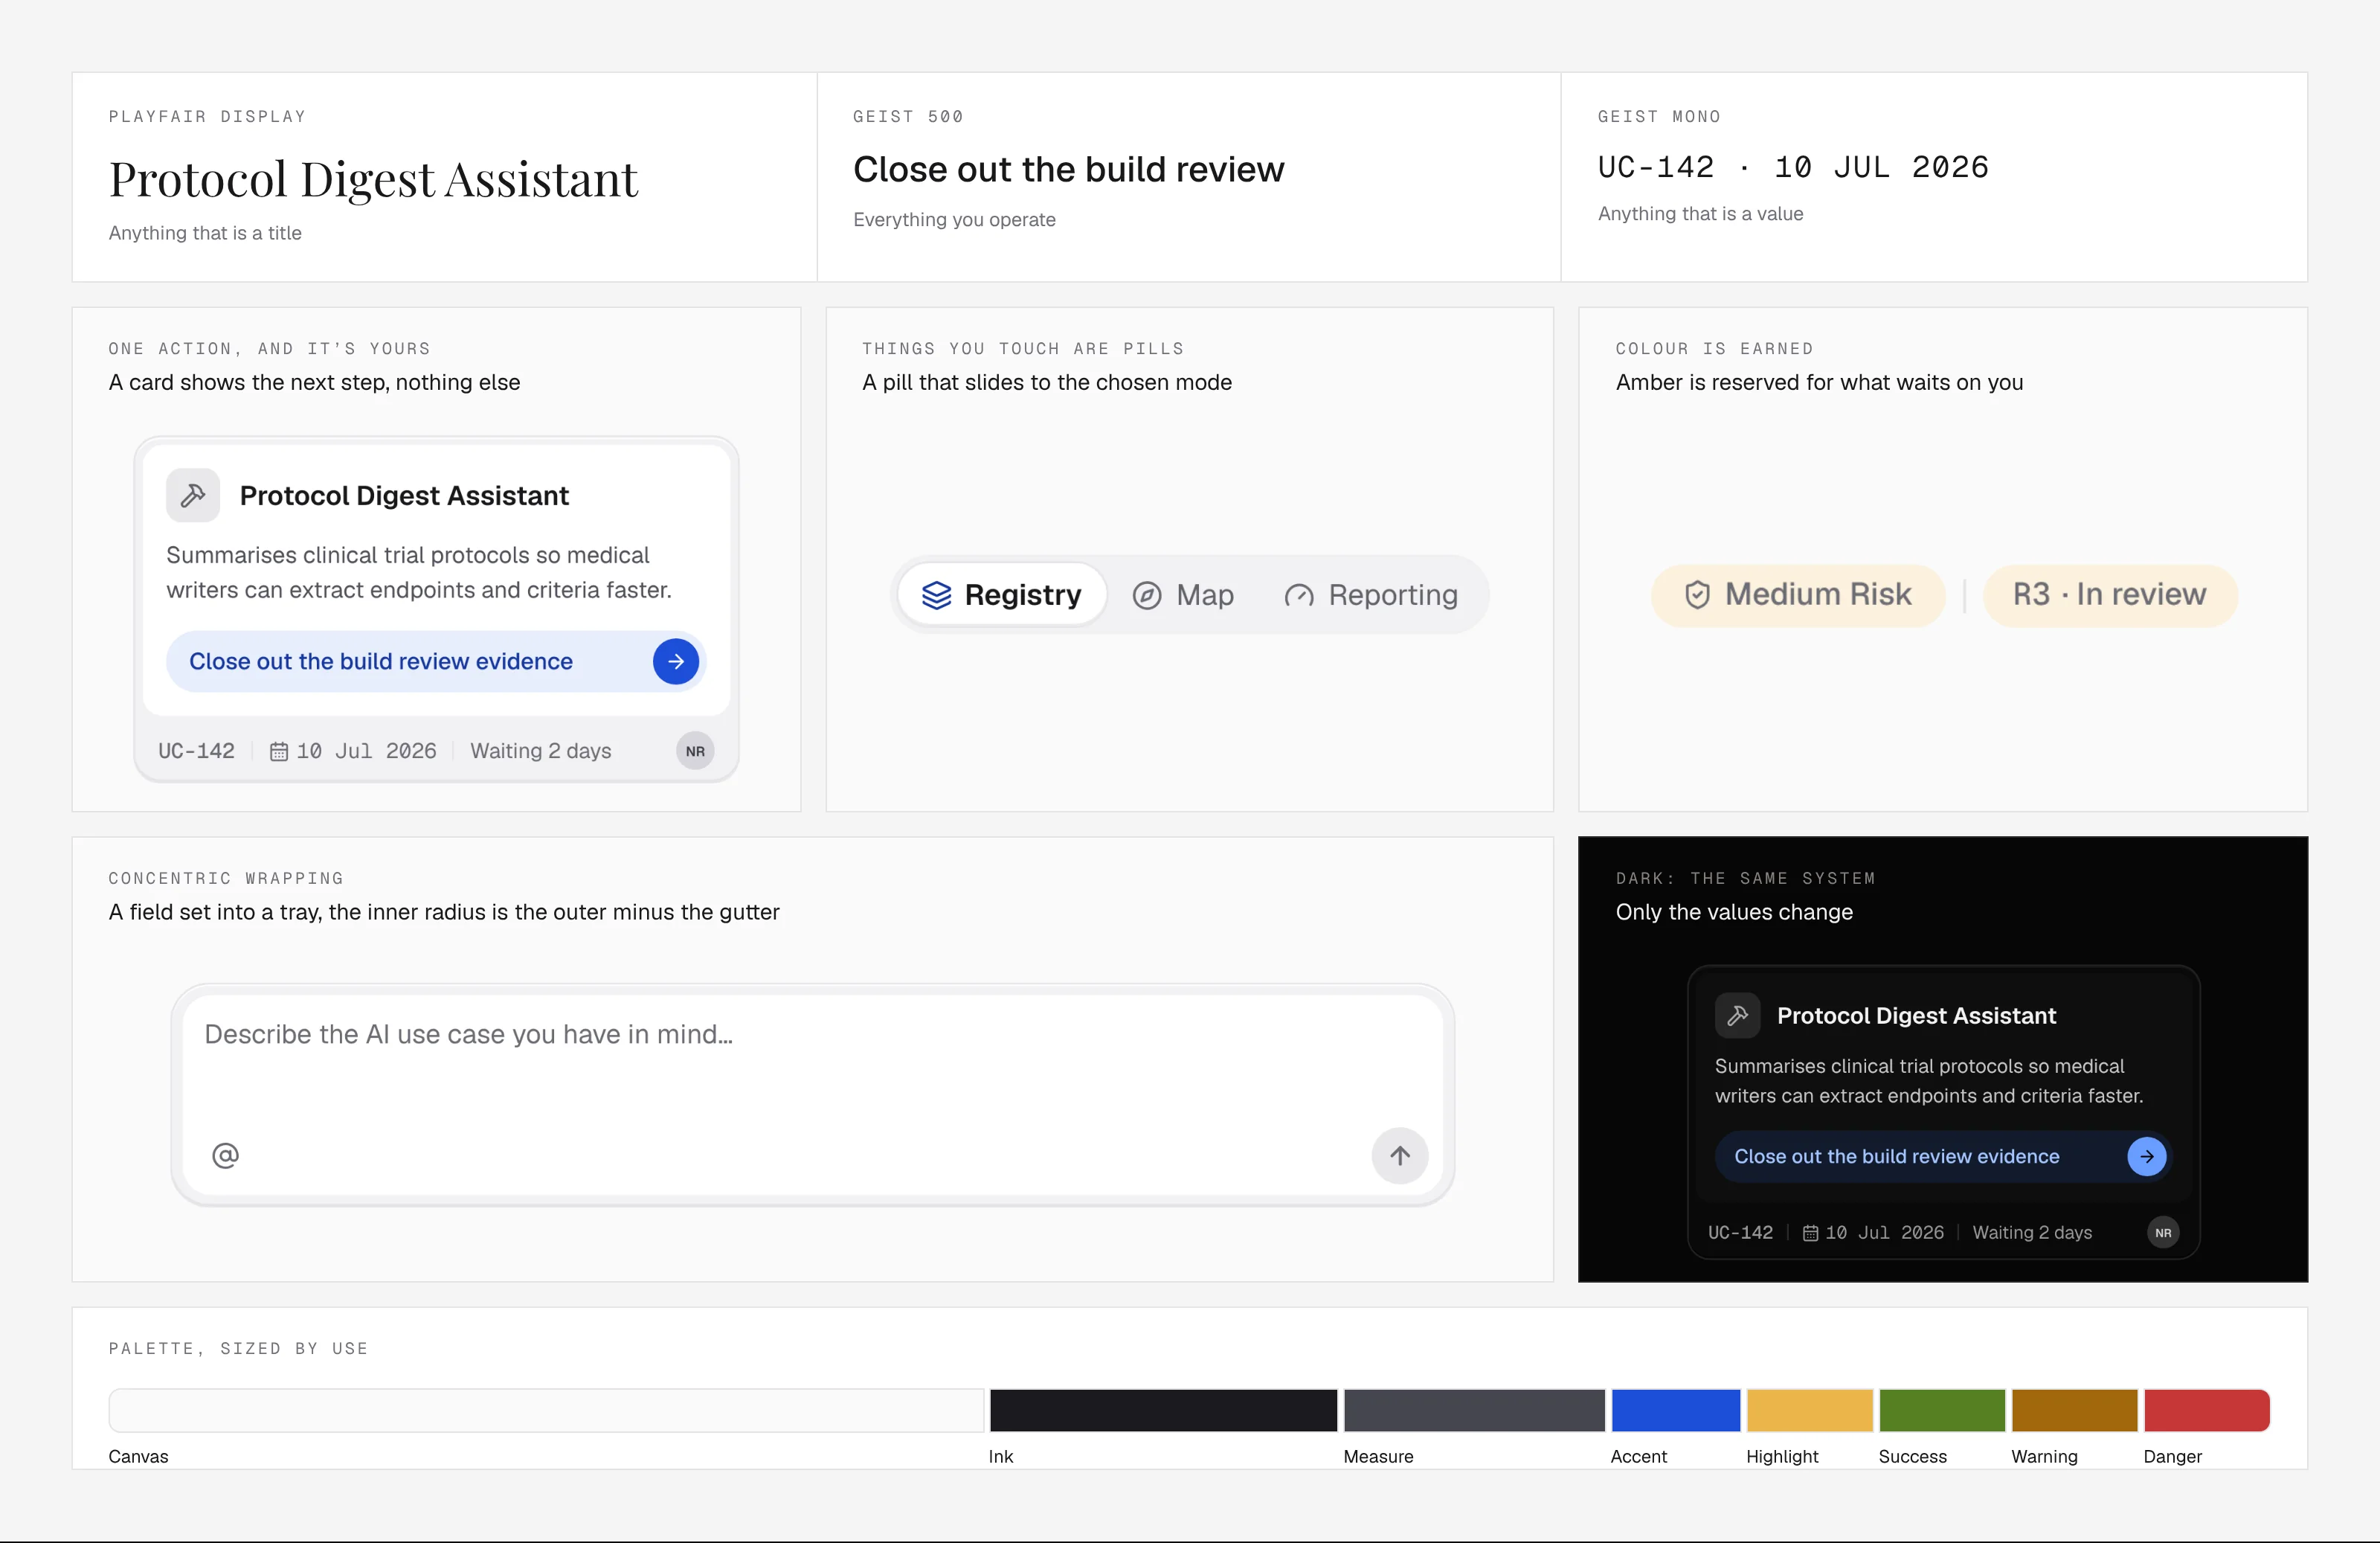
Soft Light: a pale grey page, white surfaces with thin borders, and rounded pills for anything you can click. Blue marks what’s active or yours, amber marks what’s waiting on you, and three colours mark status. Everything else is grey. Playfair for titles, Geist for controls, Geist Mono for values. Dark mode uses the same rules with different values.
−38%
median time from idea to investment decision (34 → 21 days)
2.4×
more intake submissions completed than the old 40-field form
100%
of live use cases with recorded oversight, up from 61%
6h → 1h
committee prep each quarter
18 use cases moved onto the registry in the first month.
A real model
Intake and the GTAC recommendation are simulated. Connecting a model is straightforward; recording the evidence behind each answer is the hard part.
Audit export
Export the evidence a regulator asks for, per use case and per risk tier.
Jira and ServiceNow
Keep stages in sync with delivery tools, so the record updates when the work does.
What Worked
- — Chat as intake: the record fills in as you talk, and you can see what was captured
- — Splitting the map code into geometry, drawing and input made the canvas testable
- — Removing charts did more for reporting than adding them
Challenges
- — Six rounds of SVG fixes before switching the map to canvas
- — Five roles use the same record, and each needed a different first screen
TIME: